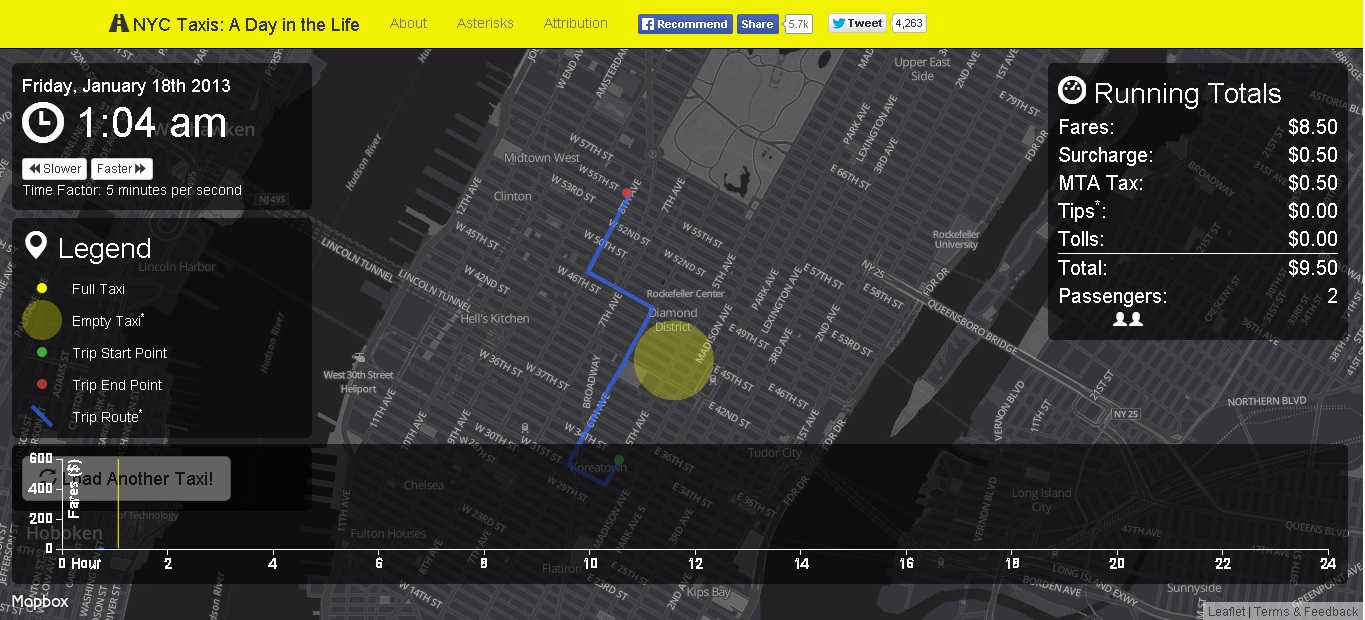
This civic technology project visualizes taxi trip data from 2013, showing the activities of a single taxi on a single day. The original data include ~170 Million trips. Of these, 30 cab/days were queried at random for inclusion in this project. The data were provided by the Taxi and Limousine Commission via a FOIL request.
The intent is to analyze running counts of fares, taxes, etc, over the course of a day, and to see how/when taxis move around New York.
The raw data include only start and end locations for each trip. These points were run through Google’s Directions API to create the routes shown in this visualization. Of course, these are Google’s best choice, not necessarily the one the taxi took.